Course Registration System
Test Evaluation Summary
For the
Architectural Prototype
Version 1.0
Revision History
|
Date |
Version |
Description |
Author |
|---|---|---|---|
| 21/March/1999 | 1.0 | Architectural prototype test evaluation | C. Smith |
|
|
|
|
|
|
|
|
|
|
Table of Contents
- Introduction
- Test Results Summary
- Test Coverage
- Code Coverage
- Defect Analysis
- Suggested Actions
- Diagrams
Test Evaluation Summary
For the
Architectural Prototype
- Introduction
- Purpose
- Scope
- assess the acceptability and appropriateness of the performance behavior(s) of the prototype
- assess the acceptability of the tests
- identify improvements to increase test coverage and / or test quality
- References
- Course Registration System Glossary, WyIT406, V2.0, 1999, Wylie College IT.
- Course Registration System Software Development Plan, WyIT418, V1.0, 1999, Wylie College IT.
- Course Registration System Iteration Plan, Elaboration Iteration #E1 , WyIT420, V1.0, 1999, Wylie College IT.
- Course Registration System Integration Build Plan for the Architectural Prototype, WyIT430, V1.0, 1999, Wylie College IT.
- Course Registration System Test Plan for the Architectural Prototype, WyIT432, V1.0, 1999, Wylie College IT.
- Test Coverage
- Performance tests involving access to the Course Catalog System
- Load tests involving access to the Course Catalog System.
- Code Coverage
- Defect Analysis
- Defect Density
- Defects by Severity Level (critical, high, medium, low)
- Defect Source (the component in which the problem or fault resides)
- Defect Status (logged, assigned, fixed, tested, closed).
- Defect Trend
- Defect Aging
- Suggested Actions
- Assign additional systems engineering resources to further evaluate the performance and loading problems associated with access to the legacy Course Catalog System. Design alternatives will be reviewed by the Project Team prior to implementation of any design solutions.
- Assign engineering resources to resolve outstanding open defects on the Prototype.
- Delay start of next iteration pending resolution of Critical and High Defects.
- Design additional tests to further test loads and access times for the Course Catalog System. Try using Rational Visual Quantify to identify and analyze the performance bottlenecks.
- It is recommended that future iterations include inspections of the all design or code involving external interfaces. These inspections should reduce the number of problems found during Test.
This Test Evaluation Report describes the results of the C-Registration Architectural Prototype tests in terms of test coverage (both requirements-based and code-based coverage) and defect analysis (i.e. defect density).
This Test Evaluation Report applies to the C-Registration Architectural Prototype. The tests conducted are described in the Test Plan for the Prototype [5]. This Evaluation Report is to be used for the following:
Applicable references are:
The test cases defined in the Test Suite for the Prototype were executed following the test strategy as defined in the Test Plan [5].
Test coverage (see Section 5.0 below) in terms of covering the use cases and test requirements defined in the Test Plan [5] was complete.
Code coverage is described in Section 6.0 and was not considered as a significant measure of success for the prototype.
Analysis of the defects (as shown in Section 7.0 below) indicates that there are significant performance problems accessing the legacy Course Catalog System. The performance and loading tests that involved read or write access to the Course Catalog System are well below the established targets. The Management Team will be assigning systems engineering resources to further evaluate these test results and to determine design alternatives.
The tests to be performed on the prototype are defined in Section 5.1 of the Test Plan [5] along with their completion criteria. The test coverage results are as follows:
Ratio Test Cases Performed = 40/40 = 100%
Ratio Test Cases Successful = 30/40 = 80%
The area of tests with the highest failure rate was:
Further detail on test coverage is available using Rational RequisitePro and the Prototype Test Case matrix.
Rational Visual PureCoverage was used to measure code coverage of the Prototype tests.
Ratio LOC executed = 12,874 / 48,916 (about 25%)
Approximately, 25% of the code was executed during the testing. It was determined that this coverage was adequate for the prototype tests as all interfaces were thoroughly exercised. Later iterations will require a significantly higher measure for code coverage.
This section summarizes the results of defect analysis that was generated using Rational ClearQuest. Section 8 recommends actions to address the findings of the defect analysis.
Data on defect density has been generated using data extracted from ClearQuest reports. Section 9 of this document includes charts that illustrate:
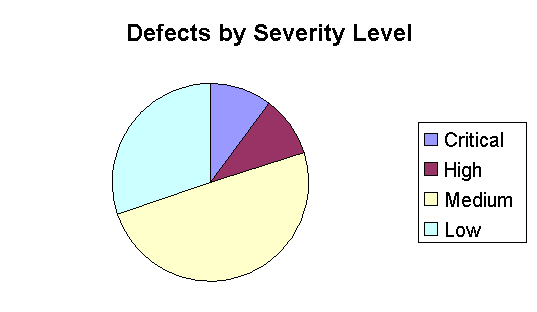
The Defects by Severity Level chart shows that 4 critical and 4 high priority defects were logged. Detailed analysis of the defect logs has shown that the critical and high priority defects are all associated with the performance and loading problems accessing the legacy Course Catalog System. (Note: Chart not included.)
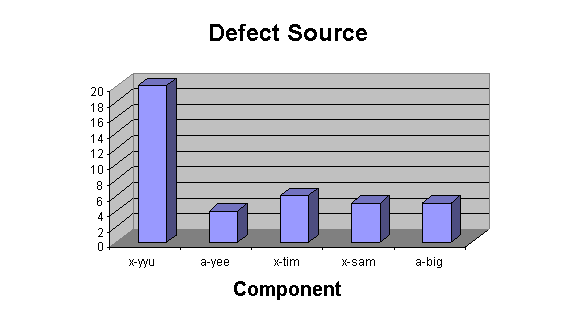
The Defect Source Chart shows an unusually high percentage of defects reside in the System Interface components.
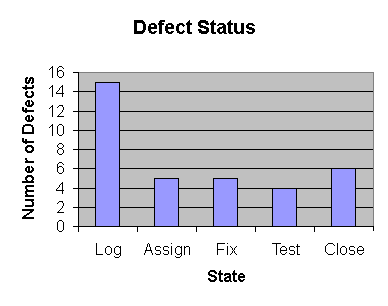
The Defect Status chart shows that many defects are in the logged state and not assigned yet for analysis.
Defect trends (i.e. defect counts over time) was not measured for the Architectural Prototype tests.
Tracking of defect age is not required for the Prototype. The current plan is to start tracking the age of open defects at the beginning of the Construction Phase. ClearQuest will be used to generate the Defect Aging Charts.
The recommended actions are as follows: