| Welcome |
 |
|
Main Description
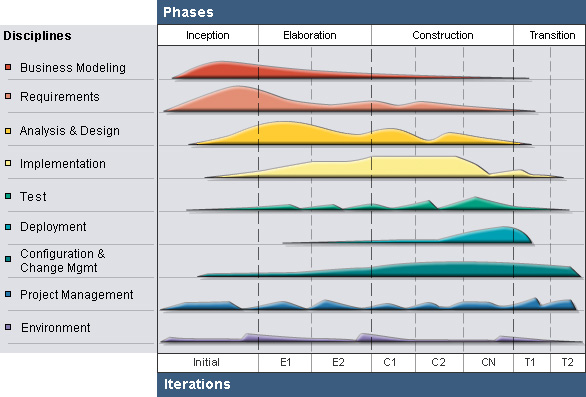
The preceding figure illustrates the overall architecture of the RUP, which has two dimensions:
The graph shows how the emphasis varies over time. For example, in early iterations you spend more time on requirements; in later iterations you spend more time on implementation. |


© Copyright IBM Corp. 1987, 2006. All Rights Reserved. |