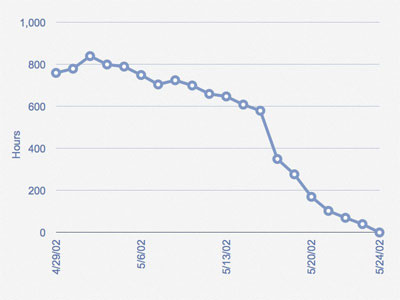
The estimated work remaining in the sprint is calculated daily and graphed, resulting in a Sprint Burndown Chart The vertical axis displays the hours of effort remaining for the Sprint. The horizontal axis displays
the days of the Sprint. The burndown is supposed to be shown by the line of descent from the start of the Sprint
with the starting hours, down to the end of the Sprint with no hours remaining.
The team does its best to pull the right amount of work into the sprint but sometimes too much or too little work is
pulled in during the Sprint Planning Meeting in this case the team needs to add or remove tasks. In the
above sprint burndown chart you can see that the team had pulled in too much work initially and still had nearly 600
hours to go on 5/16/02. In this case the Product Owner was consulted and it was agreed to remove some work from the sprint,
which resulted in the big drop on the chart between 5/16/02 (619 hours) and 5/17/02. From there the team made good
consistent progress and finished the sprint successfully.
|
